Tuesday, July 27, 2010

Facts About Growing Wedge

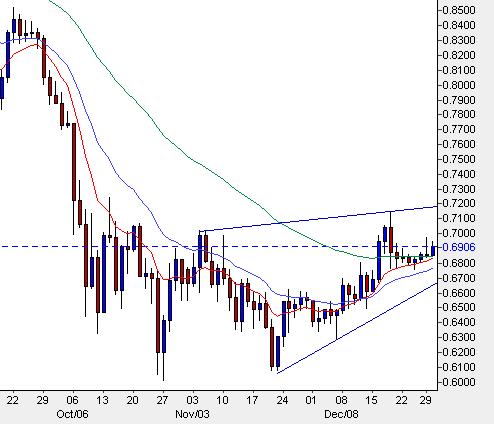
My outlook of a growing wedge is technically confirmed whenever you assess the following: The robust volume, and over a number of weeks, it is a contracting range-bound trade. You will observe the higher highs and higher lows along with slowing volume. Usually what happens next is a different break lower on solid volume.

Why Does It Happen?
As with most reversal patterns a rising wedge scenario is no different. You have an up movement rally that at first observation appears to be in an upward direction with a series of higher highs and lower highs. The flow of information from the media is collectively encouraging. The research houses are out there raising their forecasts for the stock; this includes the share price, earnings and 12 month targets. What is really happening is that the stock is being sold off to the retail investor. The experienced and institutional traders are selling off to the inexperienced mum and dad investors, the less astute or short term speculator. This is all about manipulation and deception.

The pattern embarks on a high profile or sentimental stock; it rises to a new high and proceeds upwards after strong volume. Trend trading and the exhilaration contribute to the rise in the surging share price. On the face of it the fundamental outlook appears solid.

As the share price rises to a new high, uncharacteristically the volume retracts and the share prices decline rapidly to a reaction low. The media and research analysts say us the stock is just taking a breather; they defend the sell off by requiting the long term advance. They restate their buy ratings once more. Then again the share price rises to an all time high BUT the volume deteriorates and the price begins to weaken. It is simple to comprehend at face value the bullish sentiment when the company raises its guidance, wins lucrative contracts, develops new products and good media attention.

Accordingly, underlying manipulation is being carried out as the experience traders and long term investors sell their positions, they distribute their holdings on every good piece of information in the media - while the share price reacts to the downside. The low is higher than the previous reaction low and forms the appearance of a wedge on the chart. Then after a number of sessions of consolidation more good news is released by the analysts and new wires. The share price again rallies to a new high.

During the preceding two rallies the volume is reduced which caused the share price to rapidly begin to weaken. Those same analysts who previously reported on the stock again remain resilient as there is no fundamental occurrence to account for the weakness.

Again research houses reiterate their buy ratings, advising clients to buy and build on weakness. While the longer term experienced traders /investors are selling into the market.

By this time the new advice has no result and the cost declines rapidly. The media and research houses again promote their advice but to no avail. Before long the wedge pattern structures are breached

Almost immediately after, the support at the reaction level is violated. What happens next is the news is quite negative and the inexperienced traders, the speculators and up-to-date investors panic, the price plummets. After several weeks the stock is trading back at its intermediate level of resistance.

Sunday, July 25, 2010

Alternatives Investing Related Information - How to Use the Fibonacci Technique in Foreign Exchange

The Forex trading current market is actually large and frequently intimidating to newcomers, that is why we are here. We have many years of knowledge investing currencies and have tried virtually each and every on the internet plan there is. It can be problematic.
They often don't work at all.
The foreign currency current market is such a dynamic complex system with so numerous variables at play it would be foolish to rely exclusively on 1 method to predict price tag adjustments.

When we very first started currency trading we had been just like you, a little lost with all the choices obtainable, we weren't certain where to turn, each and every broker says they offer you competitive kernel spreads, each training course claims to be the most in-depth, each and every method support claims to be ready to make you cash.

Find an investing system or technique that incorporates as many components and variables as feasible, do lots of investigation, information mining and plenty of excellent old tough operate.

Fibonacci retracements and extensions technique is very a well-known Forex trading dealing technique. Sadly, several traders lack the understanding of how and why the Fibonacci ranges perform and even more traders don't recognize how to use these amounts. Simply because it has everything about Fibonacci - from the history of the technique to the Fibonacci junction explanation to the cease-reduction recommendations when making use of Fibonacci amounts.
Leonardo Fibonacci is a popular Italian mathematician, founder of an easy sequence of amounts that refer to ratios valid for normal proportions of points on the planet.
These ratios appear from the upcoming quantities: 0, 1, 1, 2, 3, 5, 8, and 13 1, 34, 55, 89, 144, 233... And found while performing next calculations: 1+2=3, 2+3=5, and 3+5=8 etc.
If to measure the ratio of any number to one of the next higher number the result will be 0.618. For example, 13/34 = 0.382.
Fibonacci Retracement Levels are used as support and resistance levels: 0.236, 0.382, 0.500, 0.618, and 0.764. 0.382, 0.500 and 0.618) - are the most important to watch for.
Fibonacci Extension Levels are used as targets for taking profit: 0.382, 0.500, 0.618, 1.000, 1.382, 1.500, and 1.618.
The target profit is 0.618, 1.000, and 1.618 at the Fibonacci Levels.

The Golden Percentage
Right after the initial couple of quantities in the Fibonacci sequence, the proportion of any quantity to the following greater quantity is around.
618 and the lower amount is 1.618.
These two figures are the golden mean or the golden percentage.

In Fibonacci Amounts sequence, if we carry the percentage of two successive quantities in the Fibonacci series (that is, we divide each and every variety by the number soon after it in the sequence) we will gravitate towards a specific continuous worth.
That benefit is 0.6180345 which has been referred to as "the Golden Ratio".
If you also calculate the ratios utilizing alternate quantities in the Fibonacci series (that is, do the very same calculation but skip above a quantity) the resulting ratios approaches 0.38196.

Fibonacci Guides Quit Reduction Ranges
a trader can use Fibonacci quantities to established quit reduction orders.

Fibonacci Guides Position Dimension
Depending on the threat you are prepared to consider per trade, Fibonacci quantities can also define placement size.

Fibonacci Guides Objective Setting
making use of Fibonacci figures, after a pattern competes against a Fibonacci established price zone you can make use of these details to fixed profit objectives to salvage partial profits or re-adjust quit burning ranges.
Fibonacci discovered that a string of amounts and their ratios to every other occurred all through nature and in truth are extremely commonplace in the globe.

Friday, July 23, 2010

The Principles of Double Bottom for PMP Limited (PMP)

PMP Limited endured a doubling bottom. The technical share price target is calculated by using the following calculation. On the double bottom shaping you begin by adding the change between the first bottom (B1) and the reaction high. Following the second bottom, the recent reaction high is the new breakout point. It is important to be aware that for a double bottom to be confirmed the stock price must break through the reaction high and beyond.

Technical Signals

1. Prior Trend: same further reversal patterns, there must be a movement present to reverse.

2. First Trough: The first trough should symbolize the lowest point of the present trend. The first trough is clearly in a down trend and normal in its development.

3. Peak: next the opening trough a bounce occurs and an answer high is created. Usually it is between 10 and 20%. The Volume in the short rally is of no consequence. The high is often rounded in appearance as it lacks support to go on and rally higher, the price falls to the second bottom.

4. Second trough: the fall in stock cost of the reaction high eventuates on exceedingly little volume and that's when it equals the new low or bottom (B1). Whilst this price appears to be supported, the double bottom has not played out yet and time will see it eventuate.

5. Upgrade from trough: the double bottom makes the volume levels added main than a double top. It requires clear evidence that the volume and the accumulation pressure is rising upon the stock price advancing from the second trough or bottom (B2). The charge possibly could gap up, this will show signs of positive view and traders will return seeing that chance waits.

6. Resistance Break: while the price trades up to the resistance high, the double top and trend reversal is not fulfilled. The breakout from the resistance high (within the troughs) completes the double bottom design. The latest rally higher must have accelerated movements by with above medium volume.

7. Resistance Turned Support: Quite often the broken resistance level develops into a brand new support level; there is often a retest of this support level. This retest offers a second opportunity to close out a short perspective or enter a new trade to the upside.

8. Price Target: The technical share price target is calculated by using the following calculation, with the double bottom formation you start by adding the difference between the first bottom (B1) and the reaction high. Subsequent the second bottom the recent reply high is the new breakout point. The larger the formation the larger the opportunity for a likely advance higher.

Thursday, July 22, 2010

Golden Ratio Behind Trading Levels - How It Works?

The Trading Levels are based on the golden ratio of .618 applied to price. In the previous article we talked about trade management along with viewing whole numbers as psychological levels where traders tend to enter and exit trades. This article will elaborate on what these numbers are we have coined the term ‘Trading Levels'.

Leonardo Fibonacci
The slightly under recognized 13th Century mathematician Leonardo Fibonacci, noticed in nature recurring patterns that could be identified mathematically now known as the Fibonacci sequence of numbers 1, 2, 3, 5, 8, 13, 21, 34, 55, 89, 144 and so on. This numerical sequence is the sum of any two adjacent numbers in the sequence that forms the next higher number in the sequence: 1 plus 1 equals 2, 1 plus 2 equals 3, 2 plus 3 equals 5, 3 plus 5 equals 8 and so on. The ratio of any two consecutive numbers in the sequence approximates 1.618 or its inverse .618, known as the golden ratio or golden mean. This ratio is also a natural part of the Elliot Wave Theory which Robert Prechter outlines superbly in his book The Elliott Wave Principle, the bible on Ralph Elliott's price behavior theories of the 1930s.

Nearly people encounter Elliott quite complicated if in fact it's quite unfussy, and on only three rules. (It's my belief that in general traders find it difficult to follow their own trading rules let alone another's. It's a major cause why nearly traders offer their money to the professionals the rich get richer! Ask over whatsoever professional trader and they will happily explain to you that a little discipline towards their own trading rules goes a very long way.

What are Trading Levels?
We view the Fibonacci sequence simply as ‘Price' that is, 1 becomes 1 cent, 2 becomes 2 cents, 3 becomes 3 cents and so on, 5 cents, 8 cents, 13 cents, 21 cents, 34 cents, 55 cents 89 cents. The second aspect to understand is that the sequence expands by the power of 10, that is, 1 cent expands by the power of 10 and becomes 10 cents, 10 cents then becomes 100 cents or $1. Then $10 then $100 then 1000 and 10,000. High numbers like this can be used with Indices such as the Dow Jones which is currently trading at Trading Level 1 (10,000). Its previous support or Trading Level 8 (8,000) also comes into play. These are our Trading Levels and are levels of sustain and resistance in mere terms. The same principle applies to each number in the series eg. 2 becomes 2 cents (expand by the power of 10) becomes 20 cents, then $2, $20, 200, 2000 and so on, (where zinc is currently trading). The Fibonacci sequence and the expanding by the power of 10 will start to look like this: 1, 2, 3, 5, 8, 10, 13, 20, 21, 30, 34, 50, 55, 80, 89, 100, and so on. Remembering that these numbers are immediately ‘trading levels', and that whatsoever of these levels can be cents, dollars or points. The reason they work is because they have a relationship to one another and that is the golden ratio as you can see in nature itself.

Are selected levels further important than others?
Yes. More than likely 10 will have more presence over its neighboring numbers 8 and 13 as will 20 to 21 and 30 over 34, 50 over 55 and so on. As a guideline, if there has been a large correction at $10 (Trading Level 1) then there will most likely be a smaller or minor correction a the next level being $13 (Trading Level 13) so the next major correction will be at $20 (Trading Level 2). In even additional detail still for the budding Elliott observers, the guideline of alteration comes into play within wave 2 and 4 - if wave 2 is simple and sideways at trading level 1 ($10) then we can expect wave 4 to be sharp and complex. BNB is an example of that. You also commence to notice that a five wave structure of one degree will happen between the Trading Levels, making Elliott even easier. I am talking about this operating in stocks that are in cents, dollars and indices, the three charts below show you this operating.

How to use them?
Corrections can occur at these Trading Levels. Corrections are where traders can lose money and caution is warranted in avoiding being trapped in a trading pattern you don't understand. Once the correction is completed - there are many ways to work this out - then the market will continue to move. I prefer to buy into new highs and sell into new lows, volume pending. The other obvious point here is not to buy before these levels, as you will probably be moving into a profit taking correction. You need to be patient and wait until the market has rested back above a trading level and then enter once new highs are confirmed. Also a large sideways correction at a Trading Level is a good foundation for a healthy run to the next Trading Level. The Trading Levels will become more apparent once you draw the horizontal line on your chart at the appropriate levels. You will also begin to notice that there are smaller Trading Levels between two Trading Levels - it is at the 50% level that there will be the largest minor correction. This is basic to be aware of as you can move your trailing stop down under the monthly bar to ride out the storm in the tea cup.

The Trading Levels are the discovery of www.ka-ching.com.au and used as part of its 12 month trading email service on what, whenever and how we trade. The trading levels are also taught in the CMC 2 Pro Trading Course held monthly in most states.

In the next article, we will have a closer look at the constructional phases of the trade set-up and entry signal at the trading levels, the how, when and why to enter and how to place that initial stop loss under the volume for safety.

Wednesday, July 21, 2010

The Volume of Turning Up

It's been stated that everything you need to know is in the price; the fuel of cost is volume. Take volume as tide rising and falling. And, not being dumped by the small waves bouncing off the land in the rising tide. Reading the volume is like knowing when its high tides.

Price and volume
This makes charge and volume the two principal indicators in trading. Late authors such as Wyckoff and Gann understood this very much evidently. Today we call it the lost art of tape reading - reading raw data of price and volume offers the fastest and clearest understanding of what is really happening in a market. Further along in time Granville, Williams and Chaikin have added creatively to price and volume via new indicators based on the five aspects of raw data (high, low, open, close and volume) - essentially just another way to view the same things, such as divergence. Another problem with indicators is that most of them are lagging and can appear at times quite illusionary whereas reading the volume can assist your trading decisions more accurately.

The two basic rules for reading the market
1) Comparing one volume bar to the previous volume bar.
2) The relationship between the current volume bar and the current price bar, including open, high, low, close and range of price bar.

Volume analysis assists in identifying strengths and weaknesses within price structure. Perhaps in a simple trend price and volume will rise and fall together, however when this is not true then we can expect the main trend direction to change.

There is also the factor of divergence, that is, price moving up as the volume decreases, essentially your friend-trend have ended and this is easy to see as it unfolds and of course indicators will point this out much later in the game.

We can read the market with price and volume in all time frames. I use it for day trading in two and five minute bars as well as daily, weekly and monthly.

We habitually find large volume at the tops and bottoms of market trends and this is leisurely to see - depending on the type of trend and market. Profit taking, or in derivatives both shorts and longs, are being squeezed out of their positions, and so the market will run on high volume for a short period. If the movement has been steadily and building interest over time, so profit taking comes into play. There is a buyer and seller for each transaction, so there are always equal buyers and sellers. If there are more potential buyers lining up, they will push prices higher until there are no more buyers when the market then rebalances and the same applies to the down side. It's who has control in your trading time frame that matters.

A weekly chart on BSL is a reasonable chart to view volume that has excess volume at highs and lows, it is important to understand this, because this is where stops should be placed, that is, under the volume. If you see overweening volume, maybe into new highs or at Trading Levels (previous article) they are excellent entry points, strong volume after a correction is also a great entry signal as correction especially sideways corrections have low volume followed by a spike in volume, that's where entry and initial stop is placed.

A common looking tendency will have cost and volume growing, and cost and volume decreasing on the correction. Volume decreases until there are no more sellers and this is an opportunity to buy. The positive bar/candle will then come into play followed much later by other indicators. If however there is increasing volume during the correction this shows that the sellers have taken control.

We can see that the volume increases as the market moves up, with volume decreasing as the market moves down. The exposed and the closing of a bar is likewise very much chief as it shows us when change of control is taking place. The other factor is the range of the price bar in relation to the volume bar. In Figure D. the 3rd bar in from the left shows a change of trend. See if you can work out what is happening with each bar - is the closing higher than the opening, what is the price bar range, what is the volume doing? The 4th bar closes lour however the volume decreases, so there is no want for pertain, it's normal. The 5th bar is where the bulls are soaking up any bears that are left and the then market moves up on increasing volume. See if you can work out the rest of the trend.

Market Depth
Market depth can best be understood as a set of scales weighted to the most powerful - either buyer or seller. Taking CBA as an example, market depth total on Tue March 7 day of writing this article: 118 buyers for 139,553 shares, 253 sellers with 269,946 shares. Sellers are in control! Market depth be capable of besides show us where the sustain and immunity is inside the market, that is, the wholesale money. Where the largest orders are sitting on both sides of the depth is important, as the market will gravitate towards the wholesale money. A chief warning for placing entries exits and stops. Using the totals in the depth is an easy way to see who has control. The course of sales, and trade analysis of how many trades/volume are completed at a particular price, is also important showing a larger picture of support and resistance - seen visually as a bell curve.

Open Interest
Open Interest volume normally applies to the futures market upon which the Aussie 200 is based. The futures market SPI which is based of the ASX 200 Index trades approximately 30,000 contracts on a medium day and 40,000 contracts on a large day with current Open Interest around 250,000+ contracts. Open Interest adds both short and long contracts, Open Interest increases when a new contract is created and decreases when contracts are closed. A rising Open Interest demonstrates that bulls are confident enough to enter into contracts with bears, which are equally confident in their bearishness to enter into the position. There is lots more to charge, volume, open interest and market depth than this short article offers, therefore the subject is a beneficial part of market outlook and should be researched.

Tuesday, July 20, 2010

The Fundamentals Of Law Of Supply

Supply is another fundamental component in market analysis, which relates to the behavior of production and sales within the market place. The supply represents what producers are willing to sell over a wide range of prices for any given time period. The producer is willing to produce a product whilst the market price is parallel to or greater than production costs. Therefore the total supply being the quantity the producer brings to the market place. Market supply is represented by an increasing sloping charge on the vertical axis and quantity on the horizontal axis.

An increase in price will result in an increase in quantity of a product brought to market, therefore the relationship between the price and supply is positive. Factors that affect market supply behavior include; the number of producers bringing the same product to the market place, technology, the price of other commodities which could be produced, and the weather. Greater profits are the result of higher prices which in turn result in expanded production thereby increasing supply. The increase in supply will eventually satisfy the underlying demand, so therefore future production needs to have a new demand in the product for the price increase to be sustained. Consumers are not interested in what it may cost to produce the item; low prices can be an indication of over production or lack of consumer interest.

How Supply and Demand Determine Market Prices
Price is determined along the interaction of supply and demand. An interchange of goods or services will occur if buyers and sellers can agree on a cost. Whenever an interchange occurs, the agreed upon price is called the "equilibrium price", or a "market clearing price”. Both buyers and sellers are willing to exchange the quantity "Q" at the price "P". At this point supply and demand is in balance or “equilibrium". At any price below P, the quantity demanded is greater than the quantity supplied. In this situation consumers would be anxious to acquire product the producer is unwilling to supply resulting in a product shortage. When there is a shortage of a product the consumer would need to pay a higher price to get the product that they want; as producers would demand a higher charge in order to bring more products on to the market. The end outcome is a rise in prices to the point P, where supply and demand are formerly again in balance. Conversely, if prices were to rise above P, the market would be in surplus - too much supply relative to the demand. Producers would have to lower their prices in order to open the market of excess supplies. Consumers would be induced by the lower prices to increase their purchases. Prices will fall until supply and demand are again in equilibrium at point P.

Equilibrium price changes with supply and demand. For example, the recent increase in supply of oil in the Middle East, with more products being made available over a range of prices. With no increase in the quantity of product demanded, there will be movement along the demand curve to a new equilibrium price in order to clear the excess supplies off the market. Consumers will buy more but only at a lower price. This can be illustrated graphically. Any change in demand due to changing consumer preferences will also influence the market price. Whenever there has been a shift in demand of coca cola drinkers toward the Cola A variety, away from the Cola B variety. A decline in the preference for Cola B shifts the demand curve inward, to the left. With no reduction in supply, the effect on price results from a movement along the supply curve to a lower equilibrium price where supply and demand is once again in balance. In order for prices to increase producers will have to reduce the quantity of Cola B brought to the market place or find new sources of demand to replace the consumers who withdrew from the marketplace due to changing preferences or a shift in demand.

Monday, July 19, 2010

The Vital Principles of Market Theory

A market is a space where buyers and sellers meet to determine the quantities and prices at which goods or services exchange.

There are two sides to a market;
1. Buyers - they have a necessitate for a certain good or service
2. Sellers - They provide the supply of a particular good or service

The two sides interact to specify the prices and quantities exchanged. As a consumer you do not have an input in the price you pay, you accept price as given by the seller, though in some cases you can obtain reductions in price. Even though the seller sets the price their influence over price is limited by;

1. How much consumers are willing to pay
2. What other producers are charging

Prices are dictated in the market by the procedure of markets moving towards equilibrium prices and quantities occur as buyers take or reject the quantities on offer at the prices put forward by the sellers.

The Law of Supply and Demand
If we start from the simple theory that the logical action of a stock is to decline when offers are greater than the number of shares bid for, and to advance when the number of shares bid for is greater than the amount offered. For the stock market deals in shares and toll. If a trader wishes to purchase shares but can only gain those shares by offering more the price of the stock increases to absorb his purchase here demand is greater than supply. Whenever the trader wishes to sell his shares and will admit a lower price than the seller before him, the rate of the stock will be reduced here supply is greater than demand. In vision demand can outperform supply forever, though supply is limited by the zero point. In between too much supply over demand and too much demand over supply, is a state where the two are in equilibrium. This is where a similar to exchange of shares for charge can happen. Every principle that develops is in some way connected to this basic truth.

Law of Demand
To understand consumer behavior in relation to law of demand needs an understanding of fundamental analysis and factors, which characterize consumer choice? Factors which have affected demand in the past and individual consumer responses are reflected in the market place, and are a major component to understanding the economic theory relating to Law of Demand. Consumer asks for a product or service indicates how much people are willing to acquire at various prices. Thus, while all other factors remain constant consumer demand will determine the relationship between price and quantity.

As a universal rule the relationship among charge and quantity is negative, meaning the higher the price the lower the quantity in demand. On the other scale the lower the price the higher the demand for the product. Factors that can affect market value in addition to price various added services, which can encompass packaging and handling, location, quality control and financing.

Consumers are the principal driver of a free market economy and not producers. Value to a consumer of any goods and service is the determining factor of market value. The higher the price provides higher profits. Higher profits provide the impetus to expand production of goods and services. Profit driven expansion is the market's response to stronger buyer demand. Lower profits are the result of lower prices, which is induced by lack of consumer demand. Losses descend the basis to produce products, which have a weak demand but forcing production cuts resulting in loss of profits.

Law of Supply
Supply is different key element in market analysis, which relates to the behavior of production and sales within the market place. The supply represents what producers are willing to sell over a wide range of prices for any given time period. The producer is willing to produce a product whilst the market price is equal to or greater than production costs. Therefore the total supply being the quantity the producer brings to the market place.

An increase in price will result in an increase in quantity of a product brought to market, therefore the relationship between the price and supply is positive. Factors that affect market supply behavior include; the number of producers bringing the same product to the market place, technology, the price of other commodities which could be produced, and the weather.

Greater profits are the result of higher prices which in turn result in expanded production thereby increasing supply. The increase in supply will eventually satisfy the underlying demand, so therefore future production needs to have a new demand in the product for the price increase to be sustained. Consumers are not interested in what it may cost to produce the item; low prices can be an indication of over production or lack of consumer interest.

However Supply and Demand ascertain Market Prices
Price is determined by the interaction of supply and demand. An exchange of goods or services will occur whenever buyers and sellers can agree on a price. When an exchange occurs, the agreed upon price is called the "equilibrium price", or a "market clearing price”. Both buyers and sellers are eager to exchange the quantity "Q" at the price "P". At this point supply and demand are in balance or” equilibrium". At any price below P, the quantity demanded is greater than the quantity supplied. In this situation consumers would be anxious to acquire product the producer is unwilling to supply resulting in a product shortage. When there is a shortage of a product the consumer would need to pay a higher price to get the product that they want; while producers would demand a higher price in order to bring more products on to the market. The end result is a rise in prices to the point P, where supply and demand are once again in balance. Conversely, if prices were to rise above P, the market would be in surplus - too much supply relative to the demand. Producers would have to lower their prices in order to clear the market of excess supplies. Consumers would be induced by the lower prices to increase their purchases. Prices will fall until supply and demand are again in equilibrium at point P.

Equilibrium price changes with supply and demand. For instance, the latest increase in supply of oil, on products are being made uncommitted over a range of prices. With no increase in the quantity of product demanded, there will be movement along the demand curve to a new equilibrium price in order to clear the excess supplies off the market. Consumers will buy more but only at a lower price. This can be illustrated graphically: Any change in demand due to changing consumer preferences will also influence the market price. If there has been a shift in demand of coca cola drinkers towards the Cola A variety, away from the Cola B kind. A decline in the preference for Cola B shifts the demand curve inward, to the left. With no reduction in supply, the effect on price results from a movement along the supply curve to a lower equilibrium price where supply and demand is once again in balance. In order for prices to increase producers will have to reduce the quantity of Cola B brought to the market place or find new sources of demand to replace the consumers who withdrew from the marketplace due to changing preferences or a shift in demand.